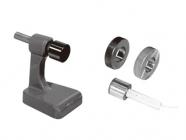
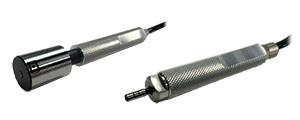
Sensor
Display Process Monitor
The optimization of the processing condition helps the analysis of the cause of the defect because the change of AE waves that is generated by the process can be identified very clearly by digital noise reduction of PULCOM GE-10 and GE-10V.

Frequency Analysis Function
Detected AE waves are analyzed by frequency analysis, and power spectrum is displayed in real time.It detects the problem that can not be distinguished by strength level of AE wave.
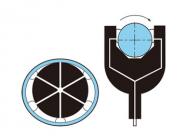
Combine with In-process Gauge
By using in-process gauge and PULCOM GE-10V to identify the processing status clearly, not only processing dimension but also the most suitable processing load, workpiece roughness, and profile accuracy are improved.
Controller specification table
| Name | GE-10 | GE-10V | |
|---|---|---|---|
| Product code | 1CH 0936001 2CH 0936002 1CH GAP / CRASH 0936153 |
1CH 0936005 (0936007*) 2CH 0936006 (0936008*) 1CH GAP / CRASH 0936156 (0936155*) *V10 build-in |
|
| Channel | 1 or 2 | 1 or 2 | |
| Display | LED Bar graph Key pad | V10A LCD with touch panel Waveform display |
|
| Trigger point | 1 (programable) | 1 (programable) | |
| Parameter set | 1 | 1 | |
| Gain control | Manual | Manual | |
| I/O | simulator | – | Monitor Only |
| Latch / Free | Pin select | Pin select | |
| PC software | AE-MONITOR | – | |
| Detection method | Acoustic Emittion | ||
| Usage environment | Temperature 0 to 45℃ Humidity 10 to 90% RH | ||
| Waterproof | IP54 (front panel only) |
||
| Vibration resistance | MAX. 4.8 G (X, Y, Z axes) * According to Accretech measuring standards (JISC60068-2-6 compliant) |
||
| Shock resistance | MAX. 25 G ( X, Y, Z axes, 10 times each) | ||
| Power requirements | DC24 V ± 10% 16 W | ||
| Analog output | Output impedance 1 K Ω | ||
| I/O input | Photocoupler input max 10 mA | ||
| I/O output | Open drain output (sink or source) 24 VDC max 40 mA | ||
| Weight | 1.1 kg | 2.0 kg | |
| CE marking | Conformity | ||